

- in South America
- in South America
- with readers working within the Retail & Leisure and Securities & Investment industries
- within Employment and HR topic(s)
US Market Review and Outlook
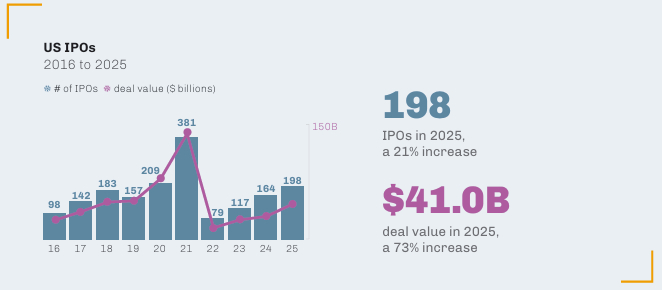
While the number of IPOs and proceeds continued to rebound from the lows set in 2022, IPO market activity in 2025 failed to match some of the optimistic predictions made earlier in the year and a true IPO market resurgence remains another year away
Steady capital market gains, the continued paring of interest rates by the Federal Reserve, and a decline in inflation all contributed to an environment conducive to increased IPO activity, and the number of IPOs increased by 21%, from 164 in 2024 to 198 in 2025.
In simple numeric terms, this total represents the third highest annual figure in the last ten years, behind only the 381 IPOs in 2021 and the 209 in 2020. The composition of the IPO market since 2022, however, remains very different than in 2021 and years prior, with smaller IPOs— many by foreign issuers—comprising a much larger share of the market. In 2021, IPOs raising gross proceeds of at least $50 million accounted for 81% of all IPOs. Over the four-year period since, IPOs raising gross proceeds of at least $50 million have accounted for only one-third of all IPOs.
While the number of IPOs raising gross proceeds of at least $50 million increased by 20%, from 60 in 2024 to 72 in 2025, this figure remains low by pre-2022 standards.
The number of IPOs with gross proceeds of at least $1 billion increased to 10 in 2025 from four in 2024.
The number of billion-dollar offerings in 2025 was the third highest figure since the dot-com boom years, behind only the 20 billion-dollar offerings in 2020 and the 26 billion-dollar offerings in 2021.
At $41.0 billion, total IPO proceeds in 2025 were 73% higher than the $23.7 billion in 2024. While lagging behind the $76.3 billion figure for 2020 and the $138.9 million total for 2021, the 2025 figure compares favorably to the annual average of $39.9 billion recorded between 2017 and 2019.
The largest IPO of 2025 was Medline, which closed very late in the year, in mid-December. Medline's $6.27 billion IPO was the largest US IPO since Rivian's $11.93 billion IPO in November 2021. The next-largest IPOs in 2025 came from Venture Global ($1.75 billion), CoreWeave ($1.50 billion), SailPoint ($1.38 billion), Klarna Group ($1.37 billion) and Figma ($1.22 billion).
The number of IPOs with gross proceeds between $500 million and $1 billion increased to 13 in 2025, from 11 in 2024. By comparison, there were 20 IPOs with gross proceeds between $500 million and $1 billion in 2020, and 45 in 2021.
Reflecting the continued high proportion of very small IPOs, the median offering size for IPOs in 2025 was $14.3 million. This figure is higher than the $10 million median offering size recorded in both 2023 and 2024, but it is just a fraction of the $144.2 million median that prevailed over the five-year period from 2017 to 2021.
The median annual revenue of IPO companies in 2025 was $18.7 million, down slightly from the $19.4 million figure for 2024 and well below the $66.9 million median observed during the five-year period from 2017 to 2021.
In 2025, 56% of life sciences IPO companies had revenue, the highest annual figure since 2016, when it was 70%. By comparison, 45% of life sciences IPO companies had revenue in 2024, a similar figure to the 46% that prevailed over the five-year period from 2017 to 2021.
The median annual revenue of non–life sciences IPO companies in 2025 was $20.6 million, down from $28.8 million in 2024 and well short of the $192.7 million median recorded between 2017 and 2021.
The percentage of profitable IPO companies increased to 63% in 2025 from 51% in 2024, far surpassing the 28% of IPO companies that were profitable between 2017 and 2021. Two of the 25 life sciences IPO companies in 2025 (8%) were profitable, compared to 71% of the non–life sciences IPO companies—the highest percentage for non–life sciences IPO companies since 2009.
IPOs by emerging growth companies (EGCs) accounted for 90% of the year's IPOs, equal to the figure for 2024, with both years only slightly higher than the 89% average that has prevailed since enactment of the JOBS Act in 2012
.jpg)
To view the full article clickhere
The content of this article is intended to provide a general guide to the subject matter. Specialist advice should be sought about your specific circumstances.


