- with Senior Company Executives and HR
- with readers working within the Metals & Mining industries
In 2022, Foley’s Government Enforcement Defense & Investigations International Team first produced a set of interactive international compliance heat maps designed to provide an at-a-glance resource for identifying countries around the world that may present heightened bribery, sanctions, or human rights compliance risks for multinational companies that conduct business in, trade with, or source materials from them.
The maps have been updated in 2024 and again in 2026, with the underlying risk ratings reviewed and revised to reflect relevant legal, regulatory, enforcement, and geopolitical developments. The updated 2026 maps are available below.
Although the maps use a structured methodology to compare risk across jurisdictions, the ratings necessarily involve professional judgment and should be understood as relative risk indicators rather than definitive country assessments. Additional information regarding the methodology is available on request.
Bribery/Corruption Risk Heat Map
This map reflects Foley’s assessment of bribery and corruption risk presented by conducting business in various countries around the world. Countries in maroon are viewed as highest risk; countries in red as high risk; countries in orange as medium/high risk; countries in yellow as medium risk; countries in light blue as low risk; and countries in dark blue as lowest risk. Companies should tailor their compliance programs and control procedures based in part on the perceived risk of bribery and corruption presented in their respective countries of operation, taking into consideration the types of business activities occurring in those countries and the degree of interaction with government officials.
Contacts: David Simon, Olivia Singelmann, John Turlais, and Nick Covek
U.S. Sanctions Risk Heat Map
This map reflects Foley’s assessment of U.S. economic sanctions risk presented by conducting business in various countries around the word. Countries in maroon are comprehensively sanctioned, and potential transactions involving these countries should not proceed without thorough legal review and authorization given the extremely high risk of violating U.S. sanctions; countries in red are deemed high risk due to significant list-based sanctions; countries in orange present moderate risk due to some list-based sanctions, coupled with a relatively high diversion risk; countries in yellow are subject to limited list-based sanctions but present some risk due to a moderate diversion risk; and countries in blue are not sanctioned and present a low diversion risk. Companies should implement screening procedures of relevant parties that take into consideration the countries associated with the transaction and with the relevant parties.
Contacts: Gregory Husisian and John Turlais
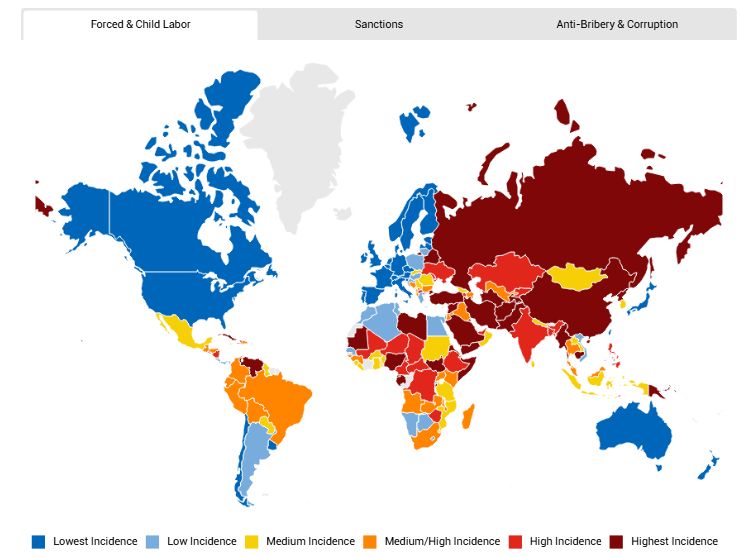
Forced Labor/Child Labor Risk Heat Map
This map reflects Foley’s assessment of the pervasiveness of child/forced labor used to produce goods in various countries around the world. Countries in maroon are perceived as having the highest incident rates of products made using child/forced labor; countries in red have high incident rates; countries in orange have medium/high incident rates; countries in yellow have medium incident rates; countries in light blue have low incident rates; and countries in dark blue have the lowest incident rates. Companies should tailor their supply-chain due diligence and monitoring procedures to account for the pervasiveness of child/forced labor in the countries from which they source raw materials and other goods.
The content of this article is intended to provide a general guide to the subject matter. Specialist advice should be sought about your specific circumstances.
[View Source]