

- within Strategy topic(s)
- within Strategy topic(s)
1. Introduction
Linear scheduling techniques can depict progress and sequencing of work in an intuitive manner. In forensic schedule analysis (FSA), these techniques can be applied to existing, validated data from CPM schedules and production data to clearly demonstrate key work and impacts thereto. When circumstances require, analysts’ interpretation of linear schedules can be utilized to bolster their understanding of a CPM schedule for use in FSA.
When presenting an FSA, analysts must accurately and effectively present critical path delays to audiences with varying levels of construction and CPM scheduling knowledge. To do this, analysts rely on visual aids, such as bar charts (i.e., Gantt charts), to depict and demonstrate delay and disruption. In simpler analyses, a bar chart can sufficiently communicate the effect of a critical path delay. However, in the analysis of certain complex delays, bar charts may not provide the detail or depth of information to properly identify and demonstrate the causes of critical path delay.
Overreliance on bar charts to depict critical path delays or disruption risks the loss of key details in a presentation of findings. Bar charts show when an activity starts and finishes and the corresponding duration, but not the pace of the work. This leaves missing information related to the production rate over time, which is particularly impactful on long-duration activities. Bar charts also do not show the timing or geographic location of discrete impacts on an activity. Furthermore, overuse of bar charts can be fatiguing for an audience trying to assess the details that may not be available.
The greater the level of detail included in a CPM schedule, the better these key details may be shown. But not every CPM schedule contains the level of detail required to depict delay and disruption clearly and with precision. In instances such as these, analysts can prepare a linear chart to help establish the causal link between impact events and activity delay or disruption, so long as the CPM schedule is validated. As stated by Bhat and Carson, “[Linear charts] can be a good platform to analyze resources in determining the lowered productivity and establishing the true cause of the lower productivity as experienced in disrupted projects.” 1
This paper examines two applications of linear scheduling techniques for evaluating delay and determining causation in FSA. The first technique involves the use of linear charts to establish causal links between impact events and activity delay or disruption, emphasized in this paper through a vertical construction example.
The second technique involves the use of linear schedules to identify the critical path and measure delay, highlighted in this paper through a horizontal construction example. Analysts can use linear schedules, with appropriate fact-based principles, to identify an accurate critical path. From this, a modified CPM schedule and adjoining linear schedules can measure delay and demonstrate causation.
2. Fundamentals of Linear Scheduling and Linear Charts
Linear scheduling refers to the technique of project planning and scheduling to model project activities that are repetitively performed. Both linear charts and linear schedules represent project progress as a factor of time and location. In doing so, they provide additional detail that a bar chart cannot — the production rate of the work performed. The x and y axes of the chart represent time and location (and at times, these are interchanged), and each line represents an activity or scope of work. When time is plotted along the x-axis, the steeper the slope, the greater the production rate. When time is plotted along the y-axis, the steeper the slope, the slower the production rate. Changes in slope tend to correspond with the locations or times at which project impacts occurred.
AACE Recommended Practice (RP) 129R-23: Linear Scheduling Methods provides an overview of the types of linear charts/schedules and breaks down methods of plotting progress by time and location into two major classifications: (i) Scheduling Techniques for Repetitively Linear Projects; and (ii) Scheduling Techniques for Physically Linear Projects.
Linear schedules used to contemporaneously plan the work will also often contain physical elements, such as profile maps and crossings, which depict topographic information. A block (i.e., gap or barrier area) on a linear schedule is a constraint that prevents or delays a linear activity from progressing at its planned rate or sequence and can indicate non-working calendars, such as winter windows, wildlife migration windows, or high-risk work zones, such as an avalanche window. RP 129R-23 provides additional detail about the various standard elements of linear schedules. 2 The figure below depicts an example of the use of some of these elements, including topographical/elevation information and a block, on a linear schedule.
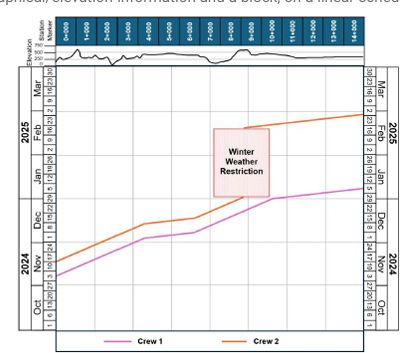
Figure 1: Simple Example of a Linear Schedule with a Winter Weather Block
In the example from the figure above, Crew 1’s production, shown by the pink line, controlled the pace of Crew 2, shown by the orange line, until the end of December 2024, just before station marker 9+000. The pace of the work between stations 0+000 and 4+000 was impacted by the rapidly changing terrain indicated in the topography illustration shown at the top of the chart. However, in the beginning of January 2025, Crew 2 hit a Winter Weather Restriction area, as denoted by the light-red block, and its work was delayed until mid-February 2025. While Crew 2 was only 1.5 weeks behind Crew 1 throughout November and December 2024, the Winter Weather Restriction caused Crew 2 to complete its work seven weeks later.
A linear chart is a visual aid used in FSA to depict the progress of a particular scope of work or activity using lines to demonstrate a production rate. Linear charts utilize visual elements to demonstrate the production rate of the work performed. Without specific location data, this principle can apply to units or percentage complete. An example of how the slope represents the production rate, in this case of meters of pipeline constructed, is shown in the figure below.
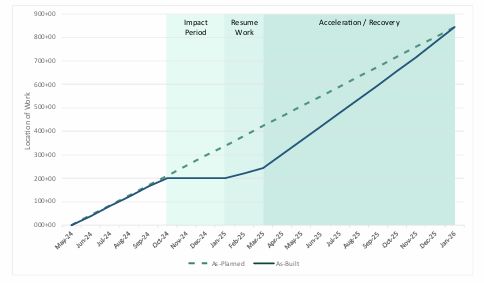
Figure 2: Simple Example of a Linear Chart: Production Rate Depicted by the Slope of the Line
In the example above, the green dashed line represents the planned production rate, and the blue line represents the as-built production rate. In the first five months, the project achieved the planned production rate. Then, between October 2024 and January 2025, progress was completely stopped at the 200+00 station marker. Between January 2025 and March 2025, work ramped slowly back up at a slower-than-planned production rate, followed by an accelerated period between March 2025 and the planned completion date in January 2026, resulting in on-time completion of the work.
Actual progress can be easily compared to the plan to understand impacts during the course of a project and compare planned and actual production. Utilization of a linear chart can identify specific troublesome locations or time periods for a project. 3
The two examples in Figures 1 and 2 above may provide a representation of the data in a more visually effective manner compared to a traditional bar chart.
3. Evaluation of Data for Forensic Application
Before an analyst creates a linear chart as part of a FSA, it is necessary to ensure the underlying data in the CPM schedule and/or linear schedule is accurate and complete.
To perform FSA accurately and present findings effectively about key work (whether the work is linear in nature or not) and impacts thereto via a linear chart, an accurate CPM schedule representing a realistic critical path and detailed production tracking information is required. If a CPM schedule does not accurately represent the project, the accuracy of FSA and the linear chart may also be diminished.
Schedule evaluation or validation is an important primary step in helping to guide an analyst’s FSA methodology. [4] AACE RP 29R-03 provides source validation protocols, which analysts can use, along with other criteria and protocols (such as the Society of Construction Law’s Delay and Disruption Protocol) to validate that the information in the CPM schedules reasonably and realistically represents the project and the critical path. 4, 5
Once validated, CPM schedules serve as a primary source of information for FSA and for the development of linear charts. The activities on the critical path in the CPM schedules can be converted into linear charts. This allows for the analysis of specific production data, identification of impacts, and establishment of causal links.
For projects where a linear schedule was maintained contemporaneously, CPM schedules and linear schedules can be used in a complementary manner, and each schedule can be used to inform the other. During the project, when planning begins with a linear schedule, analysts can assess how the CPM schedule represents the information plotted in the linear schedule, cross walking between two independent planning platforms.
However, there are important nuances to consider when evaluating a CPM schedule in concert with a linear schedule. The first nuance involves understanding the basis of project performance measurement. Linear schedules are structured around production rates, whereas CPM schedules, if not resource-loaded and managed using earned value (EVM), are structured around activity durations.
The second nuance involves understanding how activity sequences in the linear schedule are represented as logic in the CPM schedule. Linear schedules tend to have less robust logical relationships between work and crew flow than CPM schedules. Careful assumptions are needed to ensure that CPM schedules accurately depict the critical path of the project. If the nuances of translating information from a linear schedule into a CPM schedule are not considered and understood, the critical path of the project may be inaccurate. The process flow diagram on the following page illustrates the steps needed to develop a linear-chart analysis based on a CPM schedule.
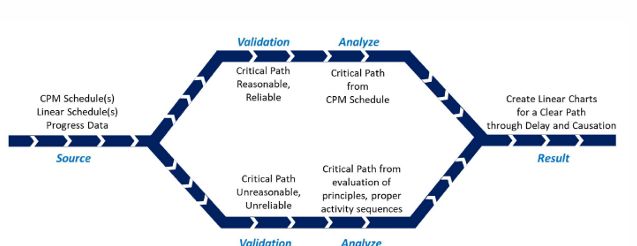
Figure 3: Process Flow Diagram for the Development of Linear Charts
As shown in the diagram above, the process starts with the collection of available source data. The source data is evaluated to determine whether it accurately represents the project and whether the critical path is reasonable and reliable. Then, once the critical path is identified, the FSA can be performed, and linear charts can be prepared to demonstrate findings related to causation of delay. The next section presents the first application of a linear schedule technique — creating linear charts for FSA.
4. Application 1: Creating Linear Charts for FSA
Based on an understanding of the CPM schedule, key sequences of work can be plotted in a linear chart. Analysts can rely on the CPM schedules for overall durations of the work, but production data, often used to help validate the CPM schedules, is also required to determine the production rate. So long as there is accurate production data (e.g., linear feet per day, units installed per week, etc.) for key work, a linear chart can be created to help depict and analyze delay and disruption.
Not all work can be clearly represented using linear charts and in such cases, it may be preferable to present impacts using a traditional bar chart. [1] However, in the case of linear or repetitively linear work, a linear chart can clearly demonstrate delay and disruption to an activity or a set of activities. For instance, in vertical construction (e.g., a high-rise building), the progress that a framing crew makes going up a building can be transcribed from a CPM bar chart to a linear chart, and the production rate of that framing crew can be compared to follow-on trades like MEP and drywall. In linear horizontal projects, like pipelines and roadways, this process is even simpler and it is not uncommon for those projects to utilize linear schedules for project controls.
Footnotes
1. S. Bhat and C. W. Carson, PS-4042 - Extending Your CPM Schedules to Embrace the Power of Linear Scheduling, Morgantown, WV: AACE International, 2023.
2. AACE International, Recommended Practice No. 129R-23 Linear Scheduling Methods (LSM), Morgantown, WV: AACE International, 2023.
3. G. Hall and A. Saifi, PS-2105 Performing Schedule Analysis and Productivity Using Linear Scheduling, Morgantown, WV: AACE International, 2016.
4. B. Celeste and A. Leavitt, CDR-4105 Assessing the Reasonableness and Reliability of CPM Schedules for Use in Forensic Schedule Analyses, Morgantown, WV: AACE International, 2023.
5. AACE International, Recommended Practice No. 29R-03 Forensic Schedule Analysis, Morgantown, WV: AACE International, 2011.
To view the full article, click here.
The content of this article is intended to provide a general guide to the subject matter. Specialist advice should be sought about your specific circumstances.
[View Source]

